Sponsor disclosure: The VPS used for this guide is sponsored by RackNerd. If you want a reliable VPS suitable for Pangolin, you can use my affiliate link.
Wazuh is an open source security platform that combines SIEM and XDR in one stack. It collects logs and telemetry from endpoints, parses them through decoders and rules on a central manager, stores alerts in an indexer, and exposes everything in a web dashboard. On top of detection it supports Active Response, so it can automatically react to events on endpoints.
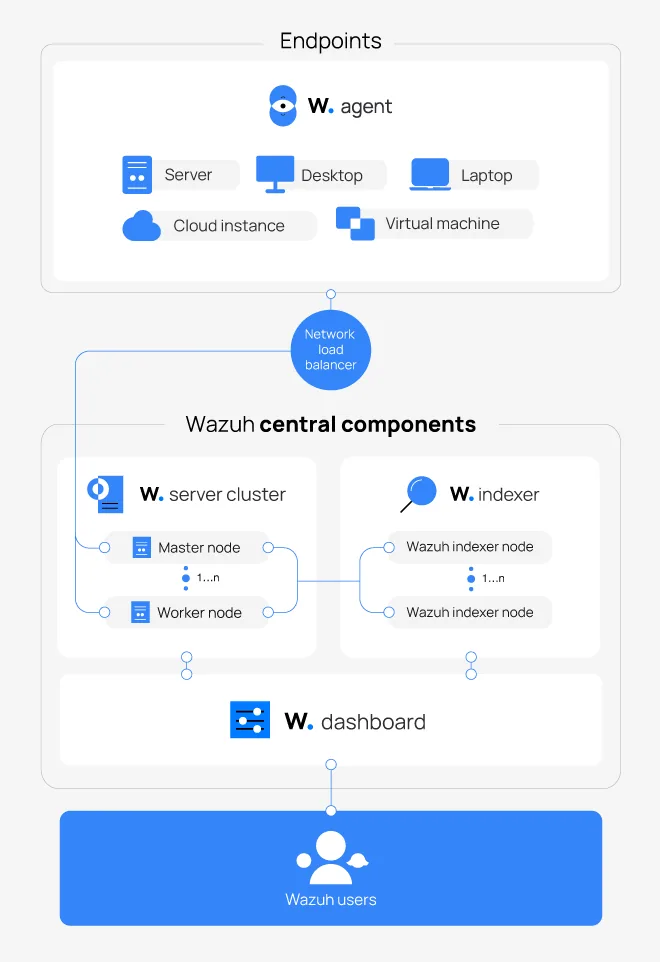
A Wazuh deployment consists of the following components:
- Wazuh Manager: Parses events, applies decoders and rules, correlates them, and triggers alerts and Active Response.
- Indexer (OpenSearch)
Stores alerts, states, and metadata so you can search, graph, and build monitors. - Wazuh Dashboard
Web-based interface built on OpenSearch Dashboards, used to manage agents, rules, configuration, alerting, and visualizations. - Agents
Lightweight collectors on endpoints that ship OS logs, security events, and host data to the manager.
Beyond log aggregation and alerting, Wazuh provides host-based intrusion detection functionality. This includes File Integrity Monitoring (FIM) for files and Windows registry keys, allowing detection of unauthorized changes to binaries and persistence locations. On Windows, this is commonly used to monitor Run and RunOnce registry keys, scheduled tasks, and critical file paths. On Linux, it can track modifications to system binaries, configuration under /etc, and other sensitive directories. These events are indexed separately from log-based detections, which makes them especially useful for persistence tracking where no corresponding Security event may exist.
Wazuh also provides native malware and endpoint protection visibility by consuming antivirus and EDR telemetry, for example Windows Defender Operational events. It does not replace an antivirus engine, but it correlates malware detections, remediation actions, protection state changes, and tampering attempts into a central detection pipeline that can be monitored and acted on consistently across hosts.
Compliance and posture assessment are super useful core features. Wazuh supports security configuration assessment (SCA) using policy templates mapped to standards such as CIS, NIST, and PCI DSS. Agents periodically evaluate endpoint configuration against these benchmarks and report drift or violations as structured findings.
On top of detection, Wazuh supports Active Response. This allows the platform to automatically react to specific alerts by executing scripts or commands on affected endpoints or on the manager itself. Typical use cases include killing malicious processes, disabling user accounts, blocking IP addresses, or ejecting removable media. This shifts Wazuh from a purely monitoring-oriented SIEM into a response-capable XDR platform.
Overview
In this post I show a simple, but practical setup:
- Install a Wazuh single node stack on Ubuntu 24.04.3.
- Onboard a Windows endpoint with advanced auditing and central agent configuration.
- Use a single custom rules file to detect:
- Privilege escalation
- PowerShell abuse
- Persistence mechanisms
- Security control tampering
- Use built in rules for:
- USB or network device related events
- Antimalware events from Windows Defender
- Build monitors in the dashboard for visibility.
- Add Active Response that:
- Ejects USB storage when a specific existing rule fires.
- Kills suspicious PowerShell sessions when Wazuh rule
91835fires.
Installing Wazuh on Ubuntu 24.04.3
Starting from a clean Ubuntu 24.04.3 LTS system, run an update and reboot:
sudo apt update && sudo apt upgrade -y
sudo reboot
After the reboot, install the all in one Wazuh stack:
curl -sO https://packages.wazuh.com/4.14/wazuh-install.sh
sudo bash ./wazuh-install.sh -a
This script:
- Installs Wazuh Manager
- Installs OpenSearch Indexer
- Installs Wazuh Dashboard
- Configures internal TLS
Install time depends on disk performance, usually 5 to 15 minutes.
At the end you get something like:
User: admin
Password: <random-password>
Store that password somewhere safe. Resetting later is possible but not pleasant.
Access the Wazuh dashboard
From a browser that can reach the server:
https://<wazuh-server-ip>
The certificate is self signed so you will get a warning. Accept it for this lab, you can later on route Wazuh through a reverse proxy.
Login with:
- Username:
admin - Password: the random value from the installer.
If the dashboard refuses to load, check the service:
sudo systemctl status wazuh-dashboard
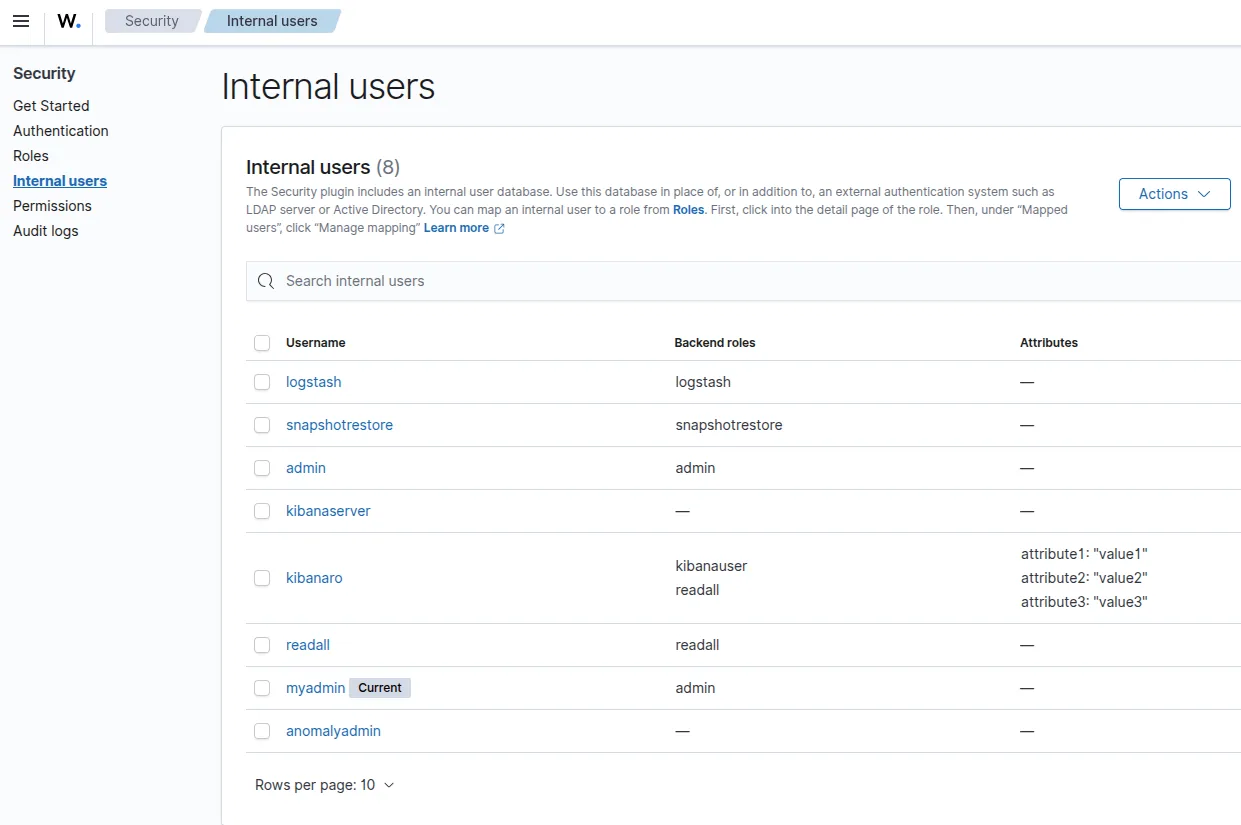
Once you can log in, do one important hardening step:
- Go to Indexer management > Security > Internal users.
- Create a new administrative account.
- Keep
adminas a break glass account and use the new one day to day.
2. Preparing the Windows endpoint
For the rest of this post I use a Windows endpoint called TESTENDPOINT with the Wazuh agent installed and Advanced Audit Policy enabled.
2.1 Enable Advanced Audit Policy
To actually see useful Security events, enable success and failure auditing.
Open an elevated Command Prompt or PowerShell on the Windows machine and run:
auditpol /set /category:* /success:enable /failure:enable
Reboot the machine after this so the audit policy is fully applied.
2.2 Deploy the Wazuh agent
As Wazuh is agent-based, in order for the endpoint to communicate with the server, we will need to deploy its agent to the endpoint. In larger environments, this would be handled with SCCM/Ansible, but in this example case, we'll do this manually. In the Wazuh dashboard:
- Open the left menu.
- Go to Home > Overview > Agents Summary.
- Click Deploy new agent.
- Choose Windows as the platform.
- Set the manager address to the IP or hostname of your Wazuh server.
- Copy the generated installation command.
On the Windows endpoint, open PowerShell as Admin and paste and execute the install command.
Once installation completes, start the service:
NET START WAZUH
Back in the dashboard, under Agents Management > Summary the Windows host should show as Active.
3. Central agent configuration for Windows logs and registry FIM
The next step is to tell the Windows agent which logs and registry paths to ship.
3.1 Configure agent.conf for the Windows group
In the Wazuh dashboard:
- Open the menu.
- Go to Agents management →Groups.
- Create or select a Windows group that includes your Windows hosts, or use the default group.
- Go to the Files tab and click Edit group configuration for
agent.conf.
Inside the <agent_config>...</agent_config> block, add or merge:
<agent_config>
  <!-- 1. Windows Security log (user creation, group changes, USB, firewall, etc) -->
  <localfile>
    <location>Security</location>
    <log_format>eventchannel</log_format>
  </localfile>

  <!-- 2. PowerShell Operational log (4103, 4104 etc) -->
  <localfile>
    <location>Microsoft-Windows-PowerShell/Operational</location>
    <log_format>eventchannel</log_format>
  </localfile>

  <!-- 3. Windows Defender logs (malware and protection state) -->
  <localfile>
    <location>Microsoft-Windows-Windows Defender/Operational</location>
    <log_format>eventchannel</log_format>
  </localfile>

  <!-- 4. Task Scheduler for persistence via scheduled tasks -->
  <localfile>
    <location>Microsoft-Windows-TaskScheduler/Operational</location>
    <log_format>eventchannel</log_format>
  </localfile>

  <!-- 5. Optional: Sysmon if you have it installed -->
  <!--
  <localfile>
    <location>Microsoft-Windows-Sysmon/Operational</location>
    <log_format>eventchannel</log_format>
  </localfile>
  -->

  <!-- 6. File Integrity Monitoring for Run / RunOnce registry keys -->
  <syscheck>
    <windows_registry>
      <registry>HKEY_LOCAL_MACHINE\Software\Microsoft\Windows\CurrentVersion\Run</registry>
      <registry>HKEY_LOCAL_MACHINE\Software\Microsoft\Windows\CurrentVersion\RunOnce</registry>
      <registry>HKEY_CURRENT_USER\Software\Microsoft\Windows\CurrentVersion\Run</registry>
      <registry>HKEY_CURRENT_USER\Software\Microsoft\Windows\CurrentVersion\RunOnce</registry>
      <frequency>3600</frequency>
      <options>realtime</options>
    </windows_registry>
  </syscheck>
</agent_config>
Save the configuration.
On the Windows endpoint, reload the agent to pick up the changes:
Restart-Service -Name wazuh
Now the manager receives:
- Security log events
- PowerShell Operational events like 4103 and 4104
- Windows Defender Operational events
- Task Scheduler Operational events
- Registry FIM on Run and RunOnce keys
which is enough for the detections I describe next.
Custom rules for key Windows security use cases
Wazuh ships with a large ruleset, but it is useful to keep your own rules in a single file for clarity and maintenance. The following is just an example, as the majority of these already exist in the default ruleset. You do not need to create these in order to set up monitoring/alerting. Custom rules should only be added when an existing rule cannot be reliably reused, otherwise built-in rules should be leveraged for alerting and Active Response. The recommended custom rule ID range is 100000 to 199999.
4.1 Creating a custom rules file
In the Wazuh dashboard:
- Open the menu.
- Go to Server management > Rules.
- Click Add new rules file.
- Name it
windows_security_custom.xml. - Paste the rule group shown below.
- Save.
You can later edit this file under:
Server management → Rules → Manage rules files → Custom rules → windows_security_custom.xml.
If you want to test rules against specific log samples, use:
Tools → Ruleset test
which wraps thewazuh-logtestcommand.
windows_security_custom ruleset
The following example covers:
- Privilege escalation
- PowerShell abuse patterns
- Persistence
- Security control tampering
<group name="windows_security_custom,">

  <!-- New local user account created -->
  <rule id="100100" level="10">
    <field name="win.system.channel">Security</field>
    <field name="win.system.eventID">4720</field>
    <description>Windows: New user account created (possible privilege escalation)</description>
    <group>windows,privilege_escalation,</group>
  </rule>

  <!-- User added to Administrators or other admin group -->
  <rule id="100101" level="12">
    <field name="win.system.channel">Security</field>
    <field name="win.system.eventID">4728|4732|4756</field>
    <field name="win.eventdata.TargetUserName">Administrators|Domain Admins</field>
    <description>Windows: Account added to admin group</description>
    <group>windows,privilege_escalation,</group>
  </rule>

  <!-- Suspicious PowerShell patterns in PowerShell Operational log -->
  <rule id="100200" level="10">
    <field name="win.system.channel">Microsoft-Windows-PowerShell/Operational</field>
    <field name="win.system.eventID">4103|4104</field>
    <match>Invoke-WebRequest|Invoke-Expression|IEX|DownloadString|FromBase64String|-nop|-enc|-ExecutionPolicy Bypass</match>
    <description>Windows: Suspicious PowerShell activity</description>
    <group>windows,powershell,attack,</group>
  </rule>

  <!-- PowerShell process created (optional detection hook) -->
  <rule id="100210" level="12">
    <if_sid>67027</if_sid>
    <field name="win.eventdata.newProcessName">C:\\Windows\\System32\\WindowsPowerShell\\v1.0\\powershell.exe</field>
    <description>Windows: PowerShell process created</description>
    <group>windows,powershell,attack,</group>
  </rule>

  <!-- PowerShell used to disable Defender real-time protection -->
  <rule id="100201" level="12">
    <field name="program_name">powershell.exe</field>
    <field name="command">Set-MpPreference -DisableRealtimeMonitoring</field>
    <description>PowerShell used to disable Windows Defender real-time protection</description>
    <group>windows,powershell,defense_evasion,</group>
  </rule>

  <!-- Registry Run keys modified (persistence) -->
  <rule id="100300" level="12">
    <if_group>syscheck_registry,</if_group>
    <field name="win.registry.key">\\Software\\Microsoft\\Windows\\CurrentVersion\\Run</field>
    <description>Windows: Persistence via Run registry key</description>
    <group>windows,persistence,</group>
  </rule>

  <!-- Scheduled task created or updated -->
  <rule id="100301" level="10">
    <field name="win.system.channel">Microsoft-Windows-TaskScheduler/Operational</field>
    <field name="win.system.eventID">106|140</field>
    <description>Windows: Scheduled task created or updated (possible persistence)</description>
    <group>windows,persistence,</group>
  </rule>

  <!-- Defender protection disabled or weakened (extends built in Defender rules) -->
  <rule id="100400" level="12">
    <if_sid>83000</if_sid>
    <match>disabled|turned off|real-time protection</match>
    <description>Windows: Defender protection has been disabled or weakened</description>
    <group>windows,defense_evasion,security_controls,</group>
  </rule>

  <!-- Firewall likely disabled or changed -->
  <rule id="100401" level="11">
    <field name="win.system.channel">Security</field>
    <match>Windows Firewall|firewall state</match>
    <description>Windows: Firewall likely disabled or misconfigured</description>
    <group>windows,defense_evasion,security_controls,</group>
  </rule>

</group>
You can always further scope rules to specific machines by adding, for example:
<field name="agent.name">^TESTENDPOINT$</field>
While it is tempting to write a custom rule for every use case, Wazuh already ships with a lot of coverage. Duplicating existing rules can cause conflicts and confusion.
Discovering existing rules from alerts
When you plug in a device or perform an action on the endpoint, check the alerts that appear in Wazuh.
In the Wazuh dashboard:
- Go to Explore → Discover.
- Select the
wazuh-alerts-4.x-*index pattern. - Filter by the agent name, for example
agent.name: "TESTENDPOINT". - Sort by
timestampand reproduce your test action.
For example, in my environment I see alerts like this when I perform certain operations:
data.win.system.eventID: 5152
data.win.system.channel: Security
data.win.system.message: "The Windows Filtering Platform has blocked a packet..."
rule.id: 60104
rule.description: "Windows audit failure event"
rule.groups: [ "windows", "windows_security" ]
decoder.name: "windows_eventchannel"
The important fields are:
data.win.system.eventIDrule.idrule.descriptionrule.groups
For this particular event, Wazuh already has rule 60104 that handles Windows audit failures such as event 5152.
For USB and external device scenarios you can use the same approach:
- Plug in the device you care about.
- Look at the new alerts in Discover.
- Note which
rule.idandrule.descriptionfired that clearly correspond to that device. - Use that existing rule id in monitors or Active Response.
This avoids clashes with built in rules and makes the configuration more robust.
To identify Event IDs, you can leverage Event Viewer on the Endpoint, in this case: Event ID 4104:
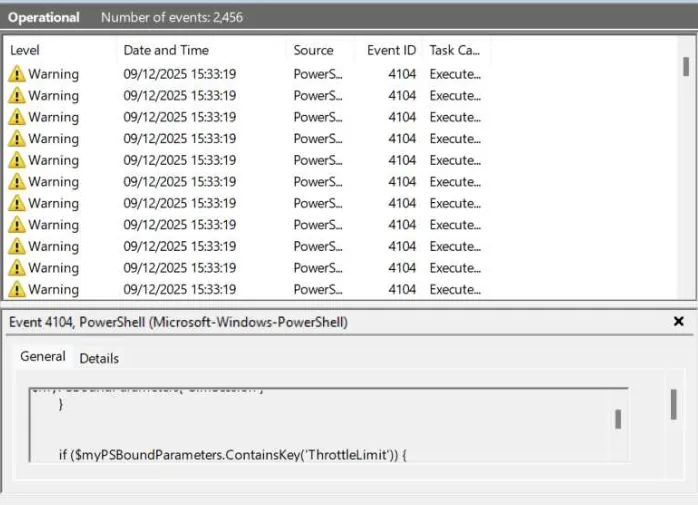
Applications and Services Logs > Microsoft > Windows > PowerShell > Operational
Antimalware coverage with Windows Defender
Earlier we enabled collection of:
<location>Microsoft-Windows-Windows Defender/Operational</location>
Wazuh ships with a dedicated rules file for Defender events. These rules cover malware detection events, threat remediation actions and protection state changes.
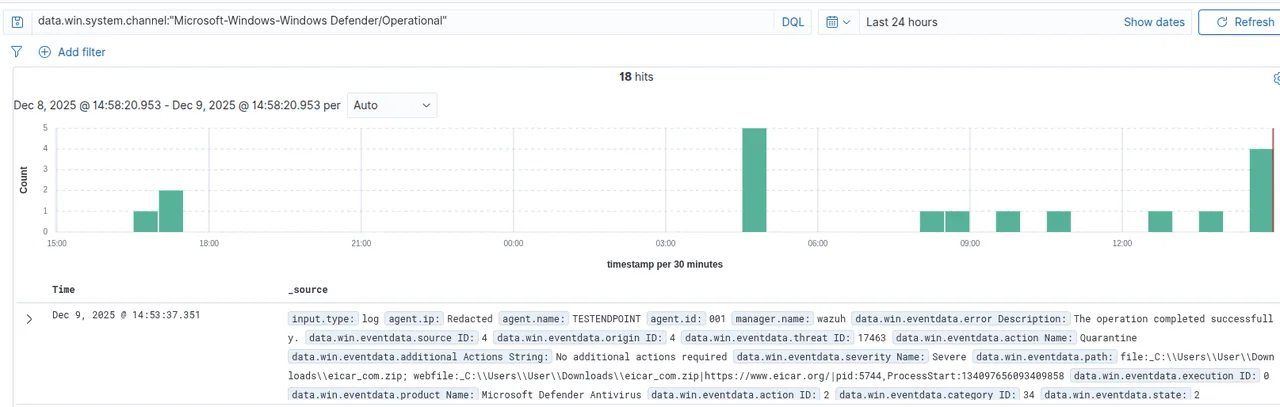
You can confirm this by triggering a Defender test alert (for example, using the EICAR test file) and then checking Discover:
- Filter
agent.namefor your host. - Filter
data.win.system.channel:"Microsoft-Windows-Windows Defender/Operational"
Monitor for malware detections
To get notified when Defender detects malware:
- Go to Explore > Alerting > Monitors > Create monitor.
- Name:
Defender Malware Detections. - Index:
wazuh-alerts-4.x-*. - Time field:
timestamp. - Schedule the monitor every 1 minute.
- Add a trigger:
- Name:
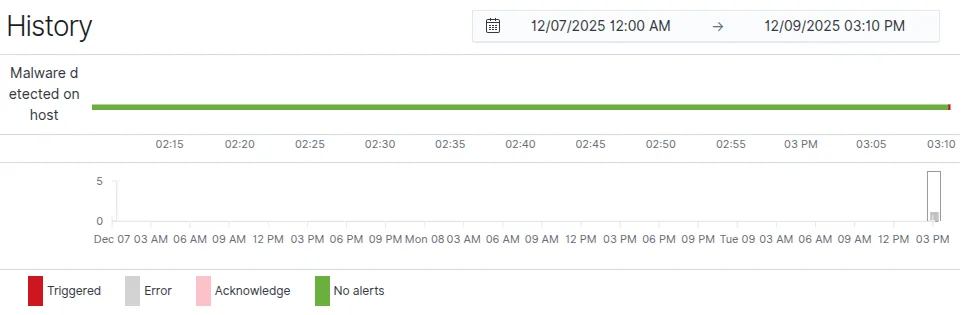
Malware detected on host. - Condition: document count greater than
0in the last minute. - Add actions:
- For example, send the alert to an n8n webhook that fans out notifications.
- Or use whatever mechanism you prefer for email, chat, or ticketing.
Query: filter on the relevant Defender rule ids or groups. For example:
rule.id: 62123 (detection event) OR rule.id: 62124 (remediation event)
This leverages the Wazuh Defender rules and gives you real time visibility into antivirus detections.
Triggering Windows Defender again will now move the Defender Malware Detections into triggered state.
Monitoring local admin account creation
To create a basic monitor to be notified when new accounts are added to the administrator group:
- Go to Explore → Alerting → Create monitor.
- Name:
Admin Account Creation. - Schedule: every 1 minute.
- Indexes:
wazuh-alerts-4.x-*. - Time field:
timestamp. - Create a trigger:
- Name: Admin
account created. - Condition: count greater than
0in the last minute. - Add an action that sends alerts externally, for example via an HTTP webhook to n8n.
Query:
rule.id: 60154
Now whenever event 4732 (local admin) occurs and hits rule 60154, the monitor will fire. For domain admins, use 4728.
Enabling Active Response
Wazuh Active Response (AR) is an automated response mechanism that executes predefined actions on endpoints or the Wazuh manager when specific security events occur. It moves Wazuh from detection to inline or near-real-time mitigation. This is the R in XDR. Wazuh Active Response lets the manager trigger scripts or commands on agents when specific rules fire.
The configuration is split between:
- The manager, where you define
<command>entries and<active-response>bindings in/var/ossec/etc/ossec.conf(or via the UI).
The agent, where the locally executable script live, under:
C:\Program Files (x86)\ossec-agent\active-response\bin
Typical flow:
- Rule X fires on an agent.
- Manager sees the alert, matches an
<active-response>block tied to thatrules_id. - Manager instructs that specific agent to execute the corresponding command. Active Response executes code as SYSTEM. Incorrect matching can terminate legitimate sessions or processes.
- Agent runs the script or executable in
active-response\bin.
First, confirm that Active Response is enabled for the agent.
On the Windows endpoint:
C:\Program Files (x86)\ossec-agent\ossec.conf
Inside <ossec_config>:
<ossec_config>
  ...
  <active-response>
    <disabled>no</disabled>
  </active-response>
  ...
</ossec_config>
This should already be enabled by default. If you change this, restart the service:
Restart-Service -Name wazuh
Active Response Example: Kill suspicious PowerShell using rule 91835
This is a simple visual example that automatically closes a PowerShell session when a user executes a command requiring administrative privileges. This is not intended for production use (obviously), but it provides a clear demonstration of Wazuhs detection and response capabilities.
12.1 Kill PowerShell script on the agent
On the Windows endpoint, create:
C:\Program Files (x86)\ossec-agent\active-response\bin\kill-powershell.cmd
Content:
@echo off
REM Kill all PowerShell instances for the host

tasklist | find /I "powershell.exe" >nul
if %ERRORLEVEL%==0 (
    taskkill /F /IM powershell.exe >nul 2>&1
)

exit 0
12.3 Command and Active Response on the manager
On the manager, go to Server Management > Settings > Edit Configuration. You can also do this via CLI under /var/ossec/etc/ossec.conf, add:
<ossec_config>
  <command>
    <name>kill-powershell</name>
    <executable>kill-powershell.cmd</executable>
    <timeout_allowed>no</timeout_allowed>
  </command>

  <active-response>
    <disabled>no</disabled>
    <command>kill-powershell</command>
    <location>local</location>
    <rules_id>91835</rules_id>
    <timeout>0</timeout>
  </active-response>
</ossec_config>
In this example, the local location refers to execution on the agent itself, not the manager.
Restart the manager by clicking Save and Restart Manager, or use the command sudo systemctl restart wazuh-manager.
Testing the PowerShell kill AR
- On
TESTENDPOINT, run a PowerShell script that matches the AntiVirusProduct enumeration pattern used in rule91835, such asiwr -Uri "https://speed.hetzner.de/100MB.bin" -OutFile "$env:TEMP\100MB.bin" - In the Wazuh dashboard, confirm that an alert with
rule.id: 91835is generated. - On the endpoint, watch your PowerShell session. It should be terminated automatically when the AR fires.
Check:
C:\Program Files (x86)\ossec-agent\active-response\kill-powershell.log
C:\Program Files (x86)\ossec-agent\ossec.log
Restart the Windows agent:
Restart-Service -Name wazuh
If the alert appears but the session survives:
- Confirm the script and
.cmdare inactive-response\bin. - Check
ossec.logfor any AR execution errors. - Verify that the rule id in
<rules_id>exactly matches the alert (91835).
Summary
Wazuh is somewhere between classic log-centric SIEMs and heavyweight commercial EDR solutions. Its strength lies in transparent detection logic, strong endpoint visibility, extensibility, and tight integration between telemetry, detection, and response, making it well suited for organizations that want deep control and observability without black-box security tooling.